IXIA IxChariot Pro
Продукт снят с продаж.
Для получения информации об актуальных продуктах, отправьте запрос
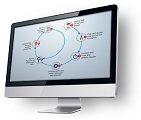
IxChariot PRO - оперативное решение для эксплуатации и полевых испытаний действующих распределенных сетей. Предназначено для активного мониторинга сети с целью измерения, контроля и диагностики сетевой инфраструктуры путём инъекции тестового трафика. Основано на открытых протоколах для интеграции с системами OSS/BSS и EMS.
Технические характеристики
- Deploy web server and probes
- Central web-based management server Installed on Microsoft Server Operating System – web-based access for operations and administration
- Software installation probes Support for Windows, Linux, Mac OS, Android, iOS, Unix, bootable USB dongle, etc.
- Web-based active probes Supported with SpeedAudit plugin
- Hardware probes xr100 and xr1000 probes
- Probes auto-discovery Central server automatically detects new probe install and discovers IP addresses
- Probe advanced configurations Supports VLAN, advanced routing, IPv6, etc., allowing easy integration with any network topology
- SpeedAudit web-based testing technology
- Feature-rich test types More than 30 pre-calibrated tests covering unified communications, voice, video streaming, TCP- and UDP-based bandwidth tests and application testing
- Test bandwidth Use endpoint-based test on software and hardware probe combinations, or use the SpeedAudit module for easy diagnostics on available bandwidth
- Web-based advanced speed test SpeedAudit module allows running a quick diagnostic from a simple web browser against reference servers; verify end users’ key throughput, delay, and loss metrics with a simple click
- Topology testing Covering node to node, one-arm real service, complex mesh, or hub and spoke topologies
- Threshold setting Threshold pre-calibrated and configured globally, can be tuned per test definition
- Test schedules Define schedules with test duration, test interval, verify 24/7, run batch test every night/week/month
- Analyze results
- Real-time dashboards Show results in real time in geographic or trend dashboards views
- Result drill-down capabilities Get global snapshot of historical data per topology, path, and test types, and drill down into results
- Simplified result presentation See results in visual Pass/Fail format; allow any user to get a quick understanding of current network/application health
- Results details Each test result is stored with a set of KPIs and threshold results
- Results comparison All tests are stored in database for user-defined retention period and can be compared for test execution and replay
- Monitor Pass/Fail for trouble spots
- KPI dashboard For selected time period dashboard, based on filtered criteria; contains pie chart on PASS/FAIL/ERROR and statistics on metrics
- Metric trend report For selected time period dashboard, based on filtered criteria: per metric and pair type trend report.
- Last 3 days dashboard Last 3 days dashboard (yesterday, day before, 2 days before), on filtered criteria; contains pie chart on PASS/FAIL/ERROR and statistics on metrics
- Last 3 period dashboard From current date, last 3 periods based on time selection (last hour, last day, etc.) dashboard, on filtered criteria; contains pie chart on PASS/FAIL/ERROR and statistics on metrics
- Top 10 dashboard Ranking of top 10 and worst 10 results per metric, based on selected criteria
- Metric trend report For selected time period dashboard, based on filtered criteria: per metric and pair type trend report
- Full report Combination of result, dashboard, and trend report
- Per-path summary report, trend, and complete Per path PASS/FAIL dashboards, trend, and complete dashboards + trend
- Site reports Per site report (using probe or probe group)
- Test results list Test results on filtered criteria
- KPI report value Test results with metrics on filtered criteria


 Отправить запрос


